(*)F/F SPOTLIGHT: Tony Gonsolin
Through the first half of the MLB season, your ERA leader is… Tony Gonsolin (RHP, LA)?
Not only does the man with a 300+ preseason ADP hold the first-half ERA crown, he also leads the majors in WHIP (0.80) and is tied for the lead in Wins (11, Verlander) in what's been the type of league-winning breakout we spend all winter trying to uncover.
But the keyword in each of those two sentences is "half". Sure, you've banked 16 starts of elite production and anything from here is gravy, but how is Gonsolin doing this, and how much of this is sustainable long-term?
We'll start this journey with a typical Fact/Fluke style analysis and see where it takes us (all stats in this article are through Tuesday, July 12):
Year   IP   ERA/xERA  BB%/K%   Vel  Ball%  SwK%  GB/LD/FB  H%/S%  HR/F  BPV
====  ===  =========  ======  ====  =====  ====  ========  =====  ====  ===
2019*  82  3.83/3.67   10/23  93.7   38.8  12.3  42/15/44  29/73    9%   79
2020   47  2.31/3.75    4/26  95.1   32.9  14.6  34/24/42  26/73    4%  135
2021   56  3.23/4.69   14/27  93.8   39.6  13.0  37/18/45  26/82   13%   55
2022   89  1.62/3.69    7/24  93.1   33.7  13.1  42/15/43  19/87    8%  103
A few things jump off the page:
- 2021's control spike looks like an outlier. He's throwing more strikes (Ball%) and limiting walks (BB%) at a better-than-league-average clip.
- A minor dip in velocity hasn't phased him, as Gonsolin's missing plenty of bats (SwK%) and holding a plus strikeout rate (K%).
- He's benefited from a "trifecta" of good fortune: Gonsolin's 19% H% is the lowest (most fortunate) of 63 qualified starters this season, his 87% S% is second-highest (second-most fortunate), and his HR/F is well below league average.
- Those luck factors have driven a major gap between Gonsolin's ERA and underlying xERA, though it's worth noting Gonsolin has outpitched his xERA in each of the last three seasons. BPV confirms he's just been good, but not elite.
If we ended the analysis here, we might conclude that Gonsolin is more of a mid/high-3s ERA pitcher and to expect serious regression the rest of the way. But the Spotlight goes deeper… let's see if we can uncover any changes in Gonsolin's approach this year, and see if our use of "fortunate" and "luck" in those last two bullet points is entirely appropriate.
Pitch Mix
The go-to place to look to see what has changed. Here's a quick snapshot of Gonsolin's pitch usage, velocity, and performance (SwK%) this season compared to 2021:

At first glance, Gonsolin's dip in fastball usage (and subsequent uptick in splitters) is noteworthy, but breaking this down further, the changes were front-loaded in April and May (FA% = Fastball usage):
Month  GS  FA%  xERA  BPV
=====  ==  ===  ====  ===
April   4   35  4.26   41
May     5   33  3.07  134
June    5   41  3.90   93
July    2   44  3.81  135
It's hard to glean too much from monthly splits here given the tiny sample sizes, but Gonsolin had both his best and worst skills months (April and May, respectively) with lower fastball usage. He has more or less reverted back to 2021's mix in June/July with a direct link to a skill change.
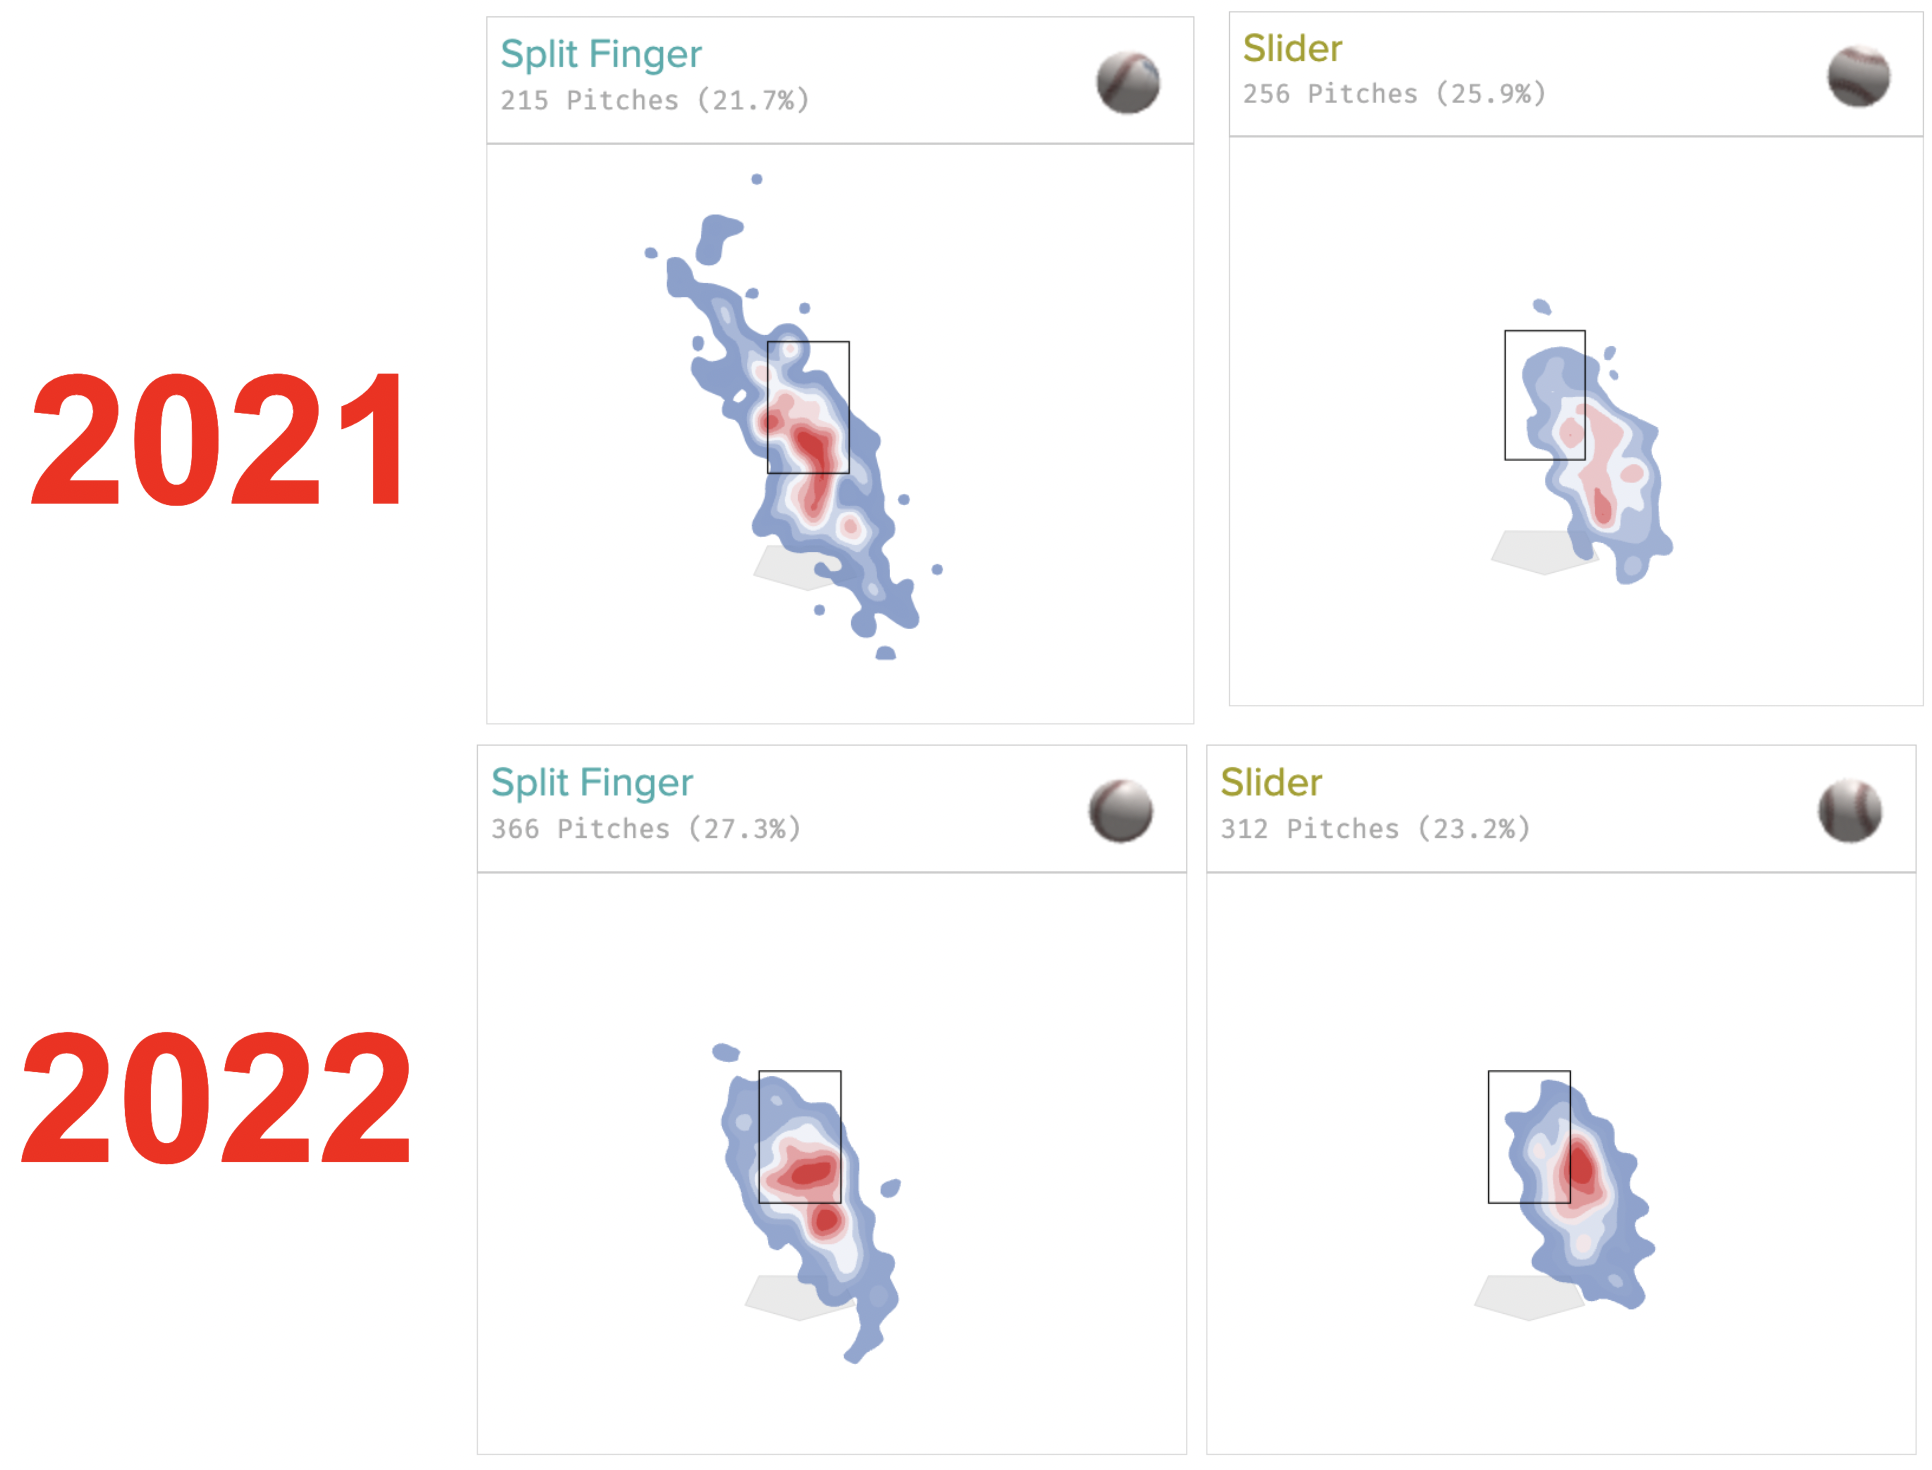
So no real change in pitch mix, but Gonsolin's ability to miss bats with two key secondary pitches—his splitter and slider—has been key to his success. Gonsolin is one of just three starters with two pitches at an 18% SwK or better (min. 300 pitches) as the location on both secondaries is much more consistent:

The tighter location on Gonsolin's two main secondary pitches has not only kept the whiffs coming, but it's worked wonders for his improved ball and walk rates this season.
Volume concerns?
Gonsolin came up through the lower minors as a reliever, then mostly switched to the rotation in the upper levels and in the majors. That lack of volume, coupled with the short 2020 season and a 2021 shoulder injury (111 IL days), yields some less-than-impressive IP totals throughout Gonsolin's career:
Year  MiLB  MLB  Total
====  ====  ===  =====
2017    70    0     70
2018   127    0    127
2019    41   40     81
2020     0   46     46
2021    12   56     68
2022     0   89     89
Gonsolin is about to eclipse the 100-IP mark for the first time since 2018, and he's on pace to reach his career-high by late-August. How far will LA push him past his previous max in September, knowing they'll need him for the postseason? And how effective will those innings be as Gonsolin enters uncharted territory?
Impossible to answer at this stage, but something worth planning for as we enter the dog days.
The Dodger Effect?
This article has been Gonsolin-centric so far… which obviously makes sense… but let's pivot and look at this from a team perspective.
LA gets a ton of credit for being one step ahead of almost every other front office. They've built a juggernaut under president Andrew Friedman with some elite pitching staffs in recent seasons. To put some numbers to this, let's compare LA's starting pitchers' ERA vs. xERA over the last three full seasons (min. 80 IP in 2019-21; min. 50 IP this season):
Year  Pitcher            ERA  xERA   Diff
====  ================  ====  ====  =====
2022  Gonsolin, Tony    1.62  3.69  -2.07
2019  Ryu, Hyun-Jin     2.32  3.47  -1.15
2021  Bauer, Trevor     2.59  3.70  -1.11
2021  Buehler, Walker   2.47  3.56  -1.09
2022  Urias, Julio      3.01  3.94  -0.93
2022  Anderson, Tyler   3.15  3.96  -0.81
2021  Urias, Julio      2.96  3.73  -0.77
2021  Scherzer, Max     2.46  3.22  -0.76
2022  Kershaw, Clayton  2.40  3.10  -0.70
2019  Kershaw, Clayton  3.03  3.55  -0.52
2019  Buehler, Walker   3.26  3.45  -0.19
2019  Stripling, Ross   3.47  3.66  -0.19
-----------------------------------------
2019  Maeda, Kenta      4.04  4.01  +0.03
2022  Buehler, Walker   4.02  3.84  +0.18
2021  Kershaw, Clayton  3.55  3.07  +0.48
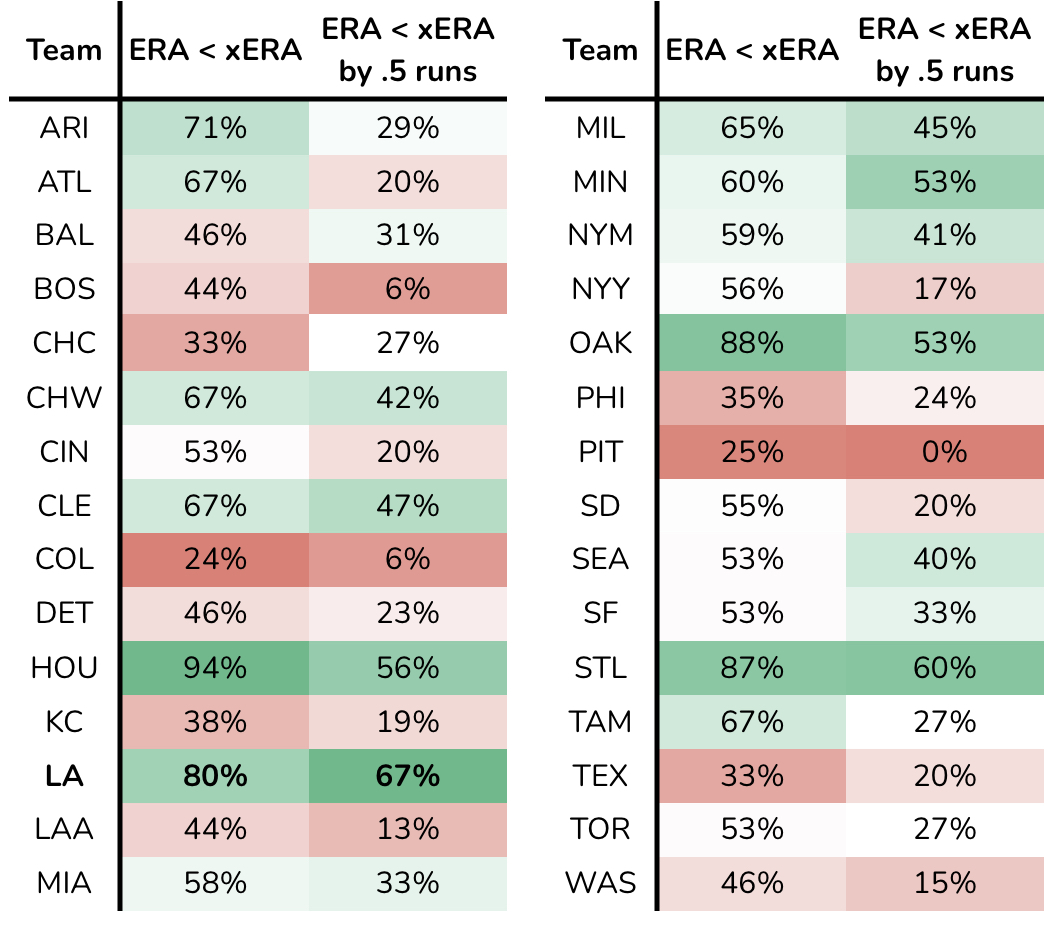
That's 12 out of 15 LA starters (80%) who have outpitched their xERA over the last three seasons, and 10 of those 15 (67%) have done so by over a half-run (and LA has mostly neutral park factors). That seems really good, but how does this compare to other teams?
Here are the percentage of starting pitchers (same IP minimums as the table above) who have outpitched their xERA, by team, since 2019:

This is an admittedly simplistic analysis—we're ignoring park factors, team defense, divisions, etc.—but LA's 80% rate of beating xERA ranks fourth behind HOU, OAK, and STL. They also have the highest percentage of any team in baseball with starters outpitching their xERA by a half-run or more.
This doesn't explain all of Gonsolin's "fortune"—his two-run ERA/xERA gap in the table above is still an extreme outlier—but in this age of pitch tunneling, spin efficiency, and whatever other private data teams have access to, it's certainly possible LA has cracked some type of code for pitching evaluation and approach. The 2022 version of teammate Tyler Anderson (LHP, LA) would definitely agree.
Conclusion
We hate to rain on the Gonsolin parade here, but outside of some improved control, he's mostly been the same pitcher he's always been. That doesn't make Gonsolin a bad pitcher—he misses bats with two excellent secondaries—but with no major changes in pitch mix, velocity, or spin, this isn't some kind of grand transformation.
Perhaps LA is playing chess while we're all staring at a checkerboard—their track record of SP outperforming their skills is impressive—but we can't just blindly appeal to authority here either. Team context might help Gonsolin beat our 3.89 ERA rest-of-season ERA projection, but he's much more likely to settle in the mid-3s than hold anything close to what we saw in the first half.
Tack on the burnout potential as Gonsolin reaches new IP heights on a team that will likely have the NL West wrapped up by September, and this seems like the ideal time to cash out your chips.


