


F/F SPOTLIGHT: Alex Gordon
May 22 2014
Typically, when a player with a proven track record gets off to a slow start, it's wise to be patient—chances are, he'll revert to form. Alex Gordon (OF, KC) is one such player. He's been a top 12 American League outfielder in each of the past three seasons, but his production has slipped dramatically early in 2014. Is a full rebound forthcoming? Let's take a closer look.
Background
Gordon, then a third baseman, was taken with the second overall pick in the 2005 draft, and moved quickly through the Kansas City system. He held his own in the big leagues in 2007-08, but the next two seasons included hip surgery, offensive struggles, and a lot of time in Triple-A.
Gordon opened the 2011 season as the Royals' starting left fielder, had a breakout year, and has never looked back. From 2011-13, he hit .287.357/.459 while averaging 19 home runs and 13 steals per season. His floor seemed reasonably high heading into 2014, but perhaps it's time to reassess.
Early 2014 Results
Gordon is off to a disappointing start, as he is batting .271/.332/.400 with three home runs and a steal in 170 at-bats. Here's a look at his BPIs:
Yr   AB   HR   SB    BA   xBA  ct%  HH%   h%    G/L/F      PX   xPX  hr/f   Spd   ISO
==  ===   ==   ==  ====   ===  ===  ===   ==   ========   ===   ===  ====   ===   ===
11  611   23   17  .303  .277   77   27   36   40/22/38   144   117   13%    85  .199
12  642   14   10  .294  .272   78   28   36   42/25/33   116   103    8%    85  .161
13  633   20   11  .265  .247   78   35   31   40/20/39   104   125   10%   121  .157
14  170    3    1  .271  .248   86   33   30   46/13/41    89    97    5%    70  .129
Gordon's below average power, along with the drop in his line drive rate, jump off the page as problem areas. His line drive rate fell to 17 percent in the second half of last season, but he more than made up for it with a 46 percent fly ball rate, and a 120/151 PX/xPX combo. He hit 10 home runs over the season's final two months, which hinted at 30-home run upside, but that type of power hasn't surfaced this season.
Gordon's fly ball rate and hard-hit percentage are similar to last year's marks, and well above his career norms, but his PX, xPX, and ISO all sit at career lows. History suggests a few more of those fly balls are likely to leave the park going forward, but that's no guarantee. According to baseballheatmaps.com, his 279 foot average per fly ball is a career low, and fangraphs.com shows that his 10.0 percent infield fly rate is well above his 7.2 percent career mark, and twice last year's number.
Gordon's contact increase would appear to be a positive in terms of batting average, but it's been offset by the line drive decline. Without a significant rebound in that department, we can't count on a mid-30s hit rate returning to boost his average. He has consistently outperformed xBA throughout his career, and is well above that mark this year as well, but a return to the .300 level is doubtful.
Gordon is off to a slow start on the base paths as well. That's not a part of his game that his driven his value in the past, but the ability to reach double digit steals has certainly enhanced it. He has just one stolen base in three attempts to this point, and his Spd score has dropped.
Plate Discipline Metrics
Digging deeper, we see several pieces of evidence that Gordon may be using a different approach at the plate in the early portion of this season. First, a few definitions, with statistics courtesy of fangraphs.com unless otherwise noted.
Swing%: Total percentage of pitches a batter swings at (League average is 45.9)
Zone%: Percentage of pitches seen inside the strike zone. (League average is 46.6)
Z-Swing%: Percentage of pitches a batter swings at inside the strike zone. (League average is 64.9)
Z-Contact%: Percentage of times a batter makes contact with the ball when swinging at pitches inside the strike zone. (League average is 86.9)
SwStr%: Swinging strike percentage (League average is 9.3)
P/PA: Pitches per plate appearance (courtesy of ESPN.com)
Year   Swing%  Zone%   Z-Swing%  Z-Contact%  SwStr%    P/PA
====    =====   ====    ======   =========   =====     ====
2011    45.3    44.9     67.6       84.6      9.1      4.00
2012    44.7    44.8     65.2       87.6      8.7      4.01
2013    45.6    43.5     65.8       86.6      9.2      4.01
2014    48.2    46.6     71.7       91.8      7.8      3.84
According to the numbers above, it appears Gordon is extremely focused on putting the ball in play this season. He is swinging at more pitches, and making contact at a significantly higher rate. This altered approach, which has thus far led to shorter at-bats, has contributed to the reduced number of strikeouts. Unfortunately, with the contact that he's been making, he simply isn't doing as much damage as he has in the past. It appears it's had a negative effect on Gordon's power numbers, which has now become a team-wide concern.
The Royals have been a major disappointment in terms of power. While their lineup isn't stocked with plus power from top to bottom, there has to be some level of concern with the team's lack of offensive proficiency. So far, they rank 28th in slugging percentage and OPS, and dead last in the majors in home runs and ISO. Interestingly enough, they have far fewer strikeouts (254) than any other team, with only one (Detroit) within 24 percent of their yearly total.
The Royals were near the bottom in the power categories last year as well, but this season, all of the bigger names are suffering power outages. Eric Hosmer (1B, KC) and Billy Butler (DH, KC) have just one home run apiece to this point, after combining for 75 home runs the past two seasons. Butler's struggles continue a trend that began last year, when his home run total dropped from 29 (in 2012) to 15, and PX from 120 to 84. In addition to those players, Mike Moustakas (3B, KC) has been a mess, batting .152 with four home runs prior to his demotion.
It's impossible to determine the root cause of the team's power outage, but maybe coaching, and/or an organizational philosophy, deserve part of the blame. We'll need more data before jumping to any conclusions, but it bears watching, as the team-wide underperformance is quite alarming.
Pitch Types
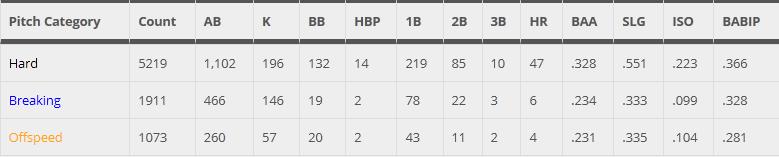
Gordon has had a great deal of success against fastballs in recent years, but that's another area where he's regressed in 2014. Here's a look at the numbers he has posted against all pitch types the previous three seasons, with the focus being on those labeled as "hard." This data is from brooksbaseball.net, and the pitches that fall into that category include four seam fastballs, sinkers, and cutters.
Now, here's a look at Gordon's numbers by category for the 2014 season.
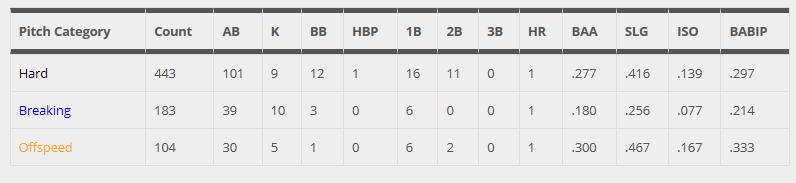
Here, too, the strikeouts are way down, but so is the power, as seen in the dramatic drop in Slg and ISO. From 2011-13, one in every 6.3 balls in play against "hard" stuff resulted in an extra base hit for Gordon, but this year, it's just one in every 7.6 balls in play.
Conclusion
Gordon has been a steady performer over the past few seasons, and his durability and potential five category contributions made him a seemingly safe pick on draft day. His start has been very slow, and while it's still a small sample, there is cause for concern for a variety of reasons. His disturbing lack of power is the most notable development, and one that will need to be corrected if he is to earn anything close to what his owners invested in him.
While Gordon is making more contact and harder contact than ever before, and hitting the ball in the air, it's simply not yielding better results. He would probably benefit greatly by reverting to his old approach of hitting more line drives. He doesn't possess elite power, and his home park reduces left-handed home runs by 25 percent, so Aug/Sept 2013 notwithstanding, a low 20s home run total represents a realistic ceiling. Increasing the line drive rate, even if it meant a few more strikeouts, would probably lead to a higher BA/xBA, and in turn, better results.
Gordon's recent track record suggests that a full rebound is possible, but the new approach has been detrimental to his production. What seemed like a fairly high floor heading into the season may now be much lower. A .260ish batting average, along with single digit home runs and a couple of steals, appears well within the range of possibilities for 2014.
More From Facts & Flukes

Health is always the big question with Byron Buxton, but what can his 2024 skills tell us about his outlook when he's in the lineup? Plus, Tylor Megill, Spencer Torkelson, Victor Scott, and Tony Santillan.
Mar 30 2025 3:08am
Mar 30 2025 3:08am

Is Jacob deGrom worth the gamble? We'll also examine Mike Trout, Carlos Rodón, Evan Carter, and Kenley Jansen.
Mar 27 2025 3:09am
Mar 27 2025 3:09am

Can Austin Riley rebound from a disappointing 2024? Plus, Clay Holmes, Max Muncy, MacKenzie Gore, and Joey Ortiz.
FREE
Mar 26 2025 3:10am
FREE
Mar 26 2025 3:10am

Paul Skenes looks to follow up his $35 R$ from 2024. What can he do for an encore? Plus Christian Yelich, Aaron Civale, Alec Bohm, and Thairo Estrada
Mar 25 2025 3:05am
Mar 25 2025 3:05am

Is Altuve declining or can he be a reliable option again? Let's examine the skills and metrics for Altuve, Bryce Miller, Jake Burger, Tanner Houck, and Dylan Moore.
Mar 20 2025 3:06am
Mar 20 2025 3:06am
