


RESEARCH: Breaking free from ADP with draft-level analytics
Mar 21 2021
**UPDATE, FEBRUARY 24, 2022: This article was named Research Article of the Year (2021) by the Fantasy Sports Writers Association. We've opened it up as a FREE READ as an example of our work at BaseballHQ.com and the value of a subscription. Ed will be updating this article with 2022 data in mid-March.***
Update, March 25: Ed has provided an updated version of the summary spreadsheet, with the following notes:
- It now includes drafts through 3/24
- It uses only the last 30 days of drafts (87 drafts)
- "Break" is now calculated as the player's ADP for the full 30-day sample minus his ADP for the last 7 days.
- Previously, it was ADP for the period before 14 days ago minus ADP for the last 14 days.
- Change is noteworthy not just because we're measuring more recent break, but also because we're comparing latest 7 days to the full sample otherwise used for the rest of the sheet. This lets the reader simply combine "ADP minus Break" to get at the player's ADP for the last 7 days. Before this was a bit fuzzier.
- For another example, Carlos Carrasco still shows up as ADP of 92.6 for the full sample, but with a Break of -100.8. His ADP for the last 7 days is 92.6 - (-100.8) = 193.4.
- For example, Shohei Ohtani has positive (meaning good) Break of +35.1 in the last 7 days. With the way I'm now calculating it, the reader can look at his full sample ADP of 186.7, subtract his break of 35.1, and get his ADP for the last 7 days of 151.6.
CLICK HERE TO VIEW the latest summary spreadsheet.
Last year we discovered (and soon we'll revisit!) what we can learn from taking a higher-level view of ADP to guide draft strategy — looking for round-by-round pockets of value by position, stat category, risk profile, and more.
This off-season, as we sought to re-create and improve upon that study for our 2021 drafts, we unearthed a hidden-in-plain-view dataset that not only will bolster the quality and precision of our planned ADP-driven draft strategy guide, but also produce some new insights in its own right. That dataset? Daily "ADP" data.
ADP of course stands for "average draft position." The most common (and BaseballHQ.com's) source of ADP data is the NFBC, which provides its users and partners with the following three fields for each player: ADP, minimum/earliest draft position (EDP), and maximum/latest draft position (LDP). Notably, NFBC offers a handy tool that lets users view/download this data for a specific date range. For this analysis, we decided to take that feature to its ridiculous extreme, and captured ADP/EDP/LDP data for each individual draft day to see if we could come up with something more useful. (Spoiler: We did.)
Creating a new dataset
Sometimes the only way to get ahead in this game is to put in the work, and this research project was no exception. The first step (or first 73 steps depending on how you count) was to cycle through each day one-by-one and download ADP data from January 1st through March 14th.
The second step (or steps 74-146 depending on how you count) was to convert each day's ADP data into individual draft records. Because each day can represent 1, 2, 3, or 4+ individual drafts, we had to devise a way to calculate or impute each player's draft position (DP) for each draft conducted that day. Here's how we handled each case:
• For days with only one draft, it's quite easy, as the player's ADP, EDP, and LDP are all the same, so they get one draft record in our draft-level dataset where DP = ADP.
• For days with two drafts, it's not much harder, as the player's EDP and LDP represent the two distinct DPs at which that player was chosen in each draft. We also know that some players were picked in only 1 of the 2 possible drafts, so for those who were picked in only one (and whose EDP and LDP are technically the same), we keep their EDP as one draft position and assign them a value of 751 for the other. 751 represents the first undrafted slot in a 50-player, 15-team draft, and is the value that NFBC uses for calculating ADP.
• For days with three drafts, we use the same process as the two-draft days to deal with players only drafted in 1 or 2 of that day's drafts, but for those picked in all 3 drafts we also need to use the player's ADP in addition to their EDP and LDP to calculate their third exact draft position for that day. Specifically, we multiply ADP*3, then subtract EDP and LDP to get the third number. For example, if Jacob deGrom has an ADP of 6, EDP of 4, and LDP of 9, we know that his third specific draft position was 6*3 = 18 - 4 - 9 = 5th.
• For days with four or more drafts, we use the same process as the three-draft days but we cannot be quite as precise. With only three numbers to work with (ADP, EDP, and LDP), or four including "number of times picked," which matters in some cases, we simply assume that all remaining unspecified draft slots fall right into the calculated middle. For example, take a four-draft day where Ozzie Albies was picked four times, with an ADP of 35, an EDP of 29, and an LDP of 38. We calculate his two "missing" draft days as 35*4=140-29-38=73, but then we need to split that 73 into two numbers without any more information. So we just divide it by the number of remaining drafts (e.g., 2) and round as necessary. In this case, 73/2=36.5, so we assign Albies one slot of 36 and one of 37. In reality, these might have been 35 along with another 38, but we just don't know. We could get a little more fancy or faux-precise if we wanted, but it's analytically safest to just pick the midpoint (though on days with 4+ drafts where a specific player went undrafted in at least one of them, it's possible to infer a few more of the draft positions vs. just using the midpoint).
In total, as of this analysis, there had been 142 fully-completed 15-team mixed drafts in the 73 day span from 1/1 to 3/14. (Note that NFBC only posts new ADP data for past dates once drafts that started on those dates have completed, so if you checked today, you'd see that more have trickled in.)
The third (or 147th) and final step was to load all of these drafts into one new database for analysis.
Defining new metrics
Now armed with a rich draft-level dataset, it's time to toss ADP data into the garbage can and see what kind of new insights draft-level data can unveil. We invite you to download this summary spreadsheet and follow along as we walk through each of the new metrics.
Median Draft Position and Mode Draft Position
Despite its ubiquity, ADP simply isn't a very useful or accurate metric for guiding fantasy managers as to when a player is actually likely to be drafted. A better guide is median draft position (MeDP), which tells us the midpoint of all draft positions where 50% of the time the player was drafted earlier than this and 50% of the time the player was drafted later than this. No calculation required — we just line up every draft and point to the one in the middle as the one most likely to be the player's true market value. As a supplement to MeDP, even mode draft position (MoDP) is a more useful indicator than ADP. MoDP tells us in what specific draft position a player was most often drafted, and is especially interesting in the early game and near the turns. Again, no calculation required — just count how many times the player was drafted at each position, and find the one with the highest number.
Both MeDP and MoDP represent real choices that real fantasy managers have made. ADP, on the other hand, is the answer to a math question ("What is the sum of all of the positions this player has been drafted divided by the count?") that no fantasy manager is really asking.
I don't mean to disparage ADP too much. As a quick-and-dirty way to check what the market is thinking in general, ADP is a decent proxy. But when you're planning and executing a draft, the details matter, and can make the difference between a draft that goes exactly as you hoped or one where nothing seems to break your way. Let's look at two 2021 early round examples:
• Imagine you're in the 13th or 14th draft position and are interested in both Alex Bregman and Tyler Glasnow around the Round 3-4 turn. They have identical ADPs of 46.2. Who do you take first in the hopes that the other will make it back to you? ADP offers no insight, but the statistically better choice is Glasnow. His MeDP is 46 and his mode is 45, while Bregman's MeDP is 47 and his mode is actually 53. Bregman's ADP is being pulled earlier by some anxious drafters in late Rd2 and early Rd3, which results in a misleading ADP. By taking Glasnow first at 3.13 or 3.14, you give yourself a better chance of still landing Bregman at 4.2 or 4.3 than you would by taking Bregman first and hoping Glasnow will make it to 4.2 or 4.3.
• Imagine you're in the 7th draft position and you desperately want a speedy shortstop with one of your first two picks (1.7 or 2.9, 24th overall). You must choose between Trea Turner and Mike Trout in Round 1. You check the ADPs and see that Bo Bichette's ADP is right at 24. It seems like a good chance you'll get him (it's his exact ADP, after all), so you take Trout in Round 1. Then you wait as the draft snakes back to you ... Story goes at pick 13, no surprise ... Mondesi goes at pick 20 ... one more ... one more ... Oh no! You get sniped by the manager picking at 2.8, and now your dream of getting a high-end speedster at SS is dashed. If only you had known that Bichette's MeDP was in fact 23, and that his MoDP was 22, you might have chosen Turner at 1.7 and then someone else who fit your master strategy at 2.9.
ADP can be very misleading whenever distribution of draft position is not statistically "normal" (which it rarely is). This truth is the basis for the next few metrics we'll discuss.
Draft Position Variation (DPV)
It seems like some players always get drafted right at or around the same exact draft position, while for others, the market is a little harder to pin down. We can now calculate this phenomenon directly rather than guessing using a simple statistic called the coefficient of variation, which we'll redub Draft Position Variation (DPV).
A player's DPV is calculated as the standard deviation of his draft positions divided by his average draft position. A typical value in 2021 drafts is ~12%. Players with lower variation can more reliably be expected to be drafted right around their ADP, while players with higher variation tend to be under- or over-drafted more often. (Note: It's best to only compare DPV of players with similar ADPs, as variation tends to get smaller as ADP gets higher.)
Fantasy managers should try to gain a good understanding of DPV, because knowing whether or not the market is fuzzy about a given player can make the difference in how aggressive or passive we might want to be at different points in a snake draft, or even how much we might consider "price enforcing" in an auction.
Here are a few quick examples of pairs of otherwise similar players whose DPVs are just about the only thing distinguishing them from one another:
• In or about Round 5, Zach Plesac and Sonny Gray have identical MeDPs of 65.5, but Plesac's DPV of 18% dwarfs Gray's 11%, meaning his draft position is much more volatile. Managers targeting Plesac may need to spring to get him in late Round 4, while those targeting Gray can more safely wait until early Round 5.
• In or about Round 12, Devin Williams' (MeDP 170.5) DPV of 17% is much higher than Rafael Montero's (MeDP 172) DPV of 11%. Williams is much more often drafted in the 9th and 14th rounds while Montero's drafters generally nab him in the 10th-13th rounds.
• In or about Round 17, Carlos Santana and Rowdy Tellez again have identical MeDPs of 268, but Tellez's DPV of 15% makes his draft position much more volatile than Santana's 9%. As a result, fantasy managers targeting Santana can usually bank on him being available in Rounds 16 through 19, while Tellez lovers have to start getting nervous as early as late Round 14 and might consider playing "ADP chicken" as late as Round 21 and still have a chance of landing him.
Outliers/Kurtosis (OK, as in "Okaaaaay, I guess that just happened")
Related to variance, but not quite the same, some players have a higher tendency than others to be drafted much earlier or much later than their ADPs would suggest. Rather than just looking at their one-off EDP and LDP, with draft-level data we can now measure the presence of outliers for each player using a statistic called kurtosis, or more specifically excess kurtosis, but since that word's hard on the brain we'll call it Outliers/Kurtosis or OK for short. This measures the extent to which the combined tails of a player's draft position distribution are bigger (OK>0) or smaller (OK<0) than if they were normally distributed. A higher OK means fantasy managers sometimes get a little silly with this player (either one manager drafts him way too early or an entire league lets him slip way too late), and a lower OK means they don't.
Some examples of 2021 players with very high OKs but otherwise normal-to-low DPVs for their draft position include:
- Nick Anderson
- Eduardo Escobar
- Eric Hosmer
- Joey Gallo
- Ian Happ
- Mike Yastrzemski
- José Ramírez
- Christian Yelich
Skew
Related to both DPV and OK, skew essentially tells us whether the player's draft position distribution has a longer/thicker high-side tail or low-side tail relative to their MeDP. Players with significant positive skew (longer/thicker right tail) can be thought to be more likely to slip a few picks or a few rounds in the draft. Players with a significant negative skew (longer/thicker left tail) can be thought of as more likely to be reached for by a few picks or rounds in the draft.
Here are some notable Top 150 ADP players with positively and negatively skewed distributions:
• High positive skew, i.e., most likely to slip later than ADP would suggest: Carlos Carrasco, Trent Grisham, José Ramírez, Jack Flaherty, Brandon Woodruff, Javier Báez, Vlad Guerrero Jr., Dinelson Lamet, Yu Darvish, JT Realmuto, Salvador Perez, Clayton Kershaw, Max Scherzer, and most Top 150 ADP closers (BONUS TIP: Don't overdraft a closer in 2021 — at least one is likely to last a bit later than his ADP would suggest)
• High negative skew, i.e., most likely to get snagged earlier than ADP would suggest: Eric Hosmer, Mike Yastrzemski, Charlie Blackmon, Aaron Judge, Rafael Devers, Shane Bieber, Christian Yelich, Blake Snell, Alex Bregman, Chris Paddack, Trea Turner, Yasmani Grandal, Pete Alonso, and Sixto Sánchez
Enough stats already, let's make it real (then add more stats)
Now it's time to pull all of this together in a way that helps us truly understand the market and specifically how we can use that understanding to form our draft strategies in advance and react in real time to the draft board as it's changing.
As I prepared for The Great Fantasy Baseball Invitational (TGFBI) a few weeks back, I used all of the above draft-level insights to help inform and execute my draft plan. But the most helpful thing that I did was to use draft-level data to calculate the likelihood that every player in the top 600 ADP would be available at every single draft slot from 1 to 450. In one color-coded plot, it looked like this:
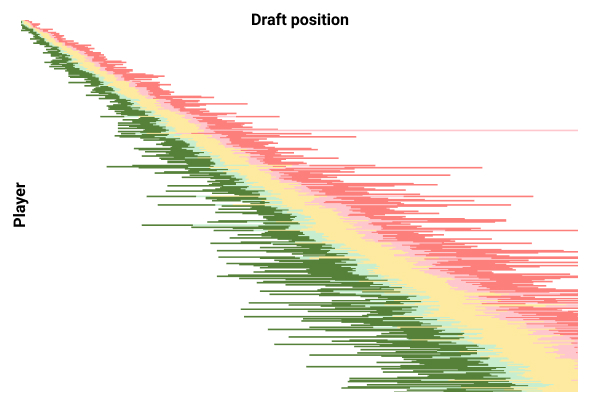
It's just as well that it's impossible to see any of the 270,000 numbers in this grid, but note the jagged edges and little twists as we snake our way from pick 1 to pick 450 from left to right and from Ronald Acuna (ADP 1) to Julio Rodríguez (ADP 600) from top to bottom. That is our draft-level data at work, because every one of those edges and twists and color changes means something:
• The jagged edges at the left and right of any player "row" are his EDP and LDP, respectively.
• The points where it changes from light green to dark green are the 90th percentile draft positions, and the points where it changes from light red to dark red are the 10th percentile draft positions.
• The twisting yellow in the middle is the 25th-75th percentile draft position zone.
• You can see how non-uniform all of these edges, points, and twists are throughout the draft. Shorter widths between the light/dark green edge to the light/dark red edge generally signify lower OK values. Shorter yellow bands generally mean lower DPVs. Differing light green vs. light red widths signify skew direction.
Armed with this % availability data, I was able to think through each draft slot strategically in the following way:
1. I made a target list of players at each draft position. For this, I focused on players with availability of 25-75%. In the 25-50% range, this exercise opened up my eyes to players who really might fall to me despite their earlier ADP. And in the 50-75% range, it reminded me to not be afraid to draft players with slightly later ADPs than my draft position. A 75% availability means that in a full quarter of all drafts that player would already have been taken by this point, so considering that player here "before his ADP" isn't a radical idea — it's his normal range! There's an important lesson here: Don't let ADPs make you feel bad about drafting the players you want.
2. I made a list of players I might want to reach for early. For this, in most cases I focused on players with availability of 75-90%. This was a really good way to keep my eye on my most important targets, knowing that there was a 10-25% chance one of my opponents might also be willing to jump a round ahead of me to get them. So depending on how my roster was shaping up, I could strategically reach as needed to get my guys without being blind or foolish about it (which I would be if all I had to go on was his ADP and EDP, which could be an outlier even among outliers).
3. I made a list of players I hoped might fall to me past their ADP. Typically these were players I liked, but not at their ADPs. For this, I focused on players with 10-25% availability. I didn't bother much with players at <10% availability, but it turns out even a number of those opportunities presented themselves. This helped me to be ready to snap up "bargains" even if it then meant risking that my original target player might be taken before my next pick.
As helpful as having that data was for me, generating it took a long time, so it's not something that can easily be updated as new draft data comes in. It also really is an unwieldy amount of data and may not be practical for anything other than slow drafts. So to bring it up a level, I decided to use the % availability breaks described above to represent five key thoughts/feelings/moments that most fantasy managers can probably identify with. Capturing these for the first time in statistical form, I present to you now in their full mnemonic glory ...
The Five S's of Snake Drafts ("Sssss" ... snake ... get it?)
The Spring — That moment when you or your opponent spring for a player much earlier than expected. This moment is represented by the player's 90th percentile DP. This is a much more useful metric than min/earliest draft position (EDP), because it gives us a sense of where a player might reasonably get taken (10% of the time ain't nothing) but where it wouldn't be a total shock to anyone.
The Snipe — That infamous moment when a player you were targeting "early" gets taken just 1 or 2 picks before you. This probably happens all the time to people too beholden to that trickster known as ADP, and intuitively likely happens closer to a player's 75th percentile DP. (This also seems like the right time to air a personal pet peeve: Outside of the first 2 rounds, if a player you wanted gets taken by your competitor at or after his ADP, you didn't get "sniped". You waited too long!)
The Settle — That feeling you get when no one quite seems right for your team and you don't want to reach for a player you hoped to get later so you settle for a guy right around his ADP just to fill a position or to build pitching depth. This tends to happen with players drafted right around their median/50th percentile DP.
The Steal — That thought that pops into your head as the draft wraps back to you and a player you honestly didn't think would still be on the board is still on the board but you know he won't make it back ... but he might make it back ... now he probably will make it back ... and he does make it back to you! This thinking tends to happen with players around their 25th percentile DP.
¯\_(ツ)_/¯ a.k.a. The Shrug — One of two feelings you have when you draft a player, often the top player left on the board, for better or worse, around his 10th percentile DP or lower. Similar to the Spring above, this is a much more useful metric than max/latest draft position (LDP), because it gives us a sense of where a player might reasonably fall. Sometimes there's a reason he fell so far (often new uncertainty), so your shrug means "Sure, why not? He's cheap." But sometimes a guy just slips and slips and no one can believe it yet they too keep passing and finally he falls into your lap 3 rounds later than he should have and you shrug and say "Hey, don't blame me. You coulda had him!"
Now, instead of a simple list of players ordered by ADP, we can really start to sense the push and pull that happens in drafts and strategize and react accordingly. Let's zoom in on the middle of "Round 5" by ADP as an example:
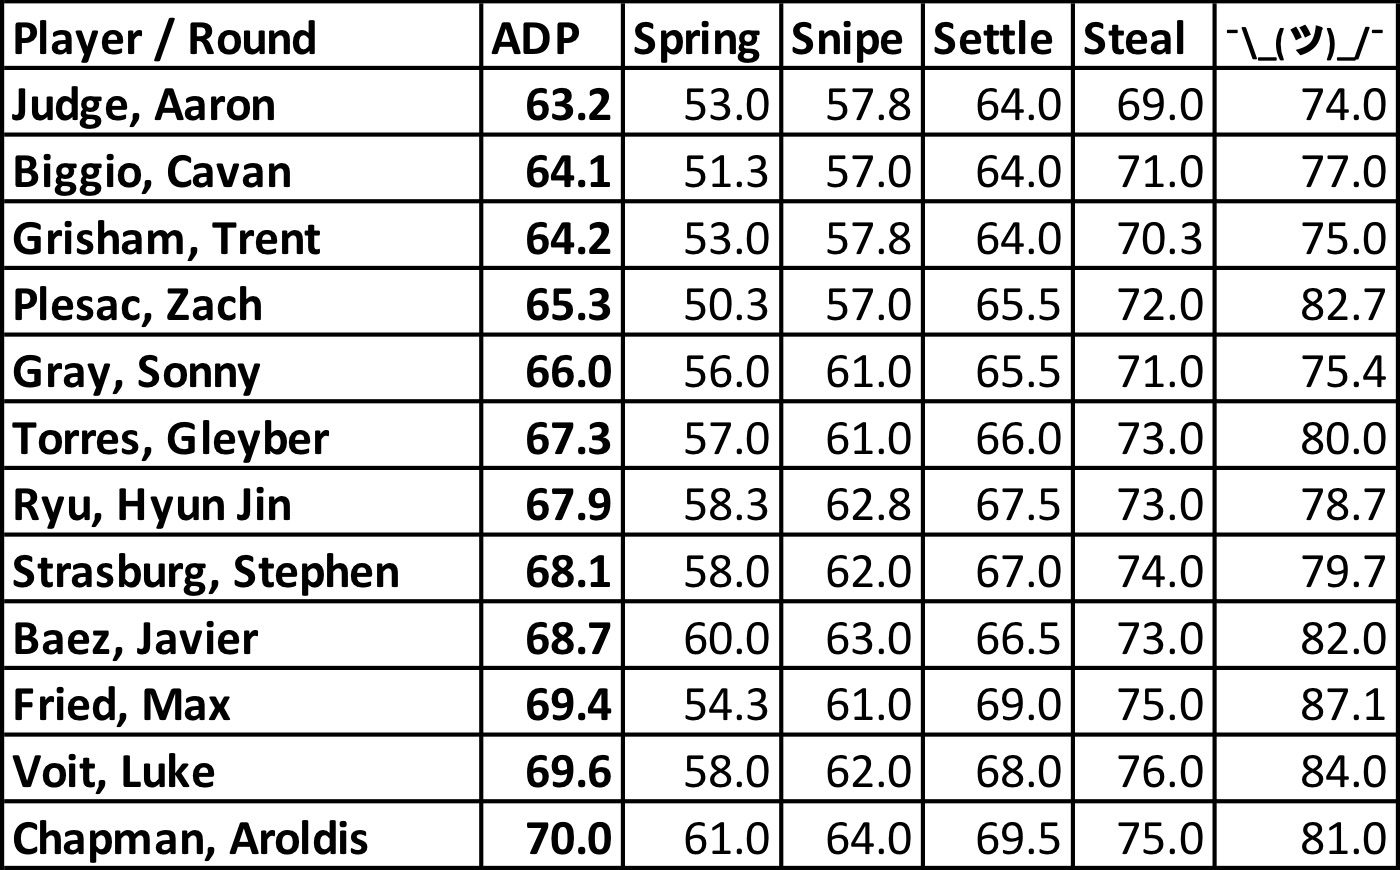
12 players bunched up into 8 slots by ADP doesn't tell us much, but the 5 S's give us so much more to go on, revealing who we should consider springing for in Round 4, who we might get sniped on if we wait until Round 5 (and who we might need to settle on if that happens), and who might even become a steal or shrug in Round 6. Some examples:
• Anyone heavily targeting Cavan Biggio or Zach Plesac needs to be prepared to spring for him as early as early Round 4.
• Anyone drafting from the 1-8 slots who is comfortable with Gleyber Torres or Javier Báez at SS can avoid drafting a SS earlier and wait patiently for one to fall to them in Rd 5. Both have similarly tight ranges and are unlikely to be sniped earlier.
• Anyone looking for a solid SP in Round 4-6 needs to be clear on their target. Those drafting from the 9-15 slots might have trouble landing Sonny Gray or Hyun Jin Ryu, but are more likely to end up with Plesac, Strasburg, or Fried. If those pitchers aren't on their target list, though, then they could consider changing their draft strategy to take a hitter here and build pitching in other rounds.
We could go on and on with different scenarios — the point is that different fantasy managers target different players, and different players have different draft profiles that make them more or less likely to be available "at their ADP", so depending on one's specific targets and draft position, one's entire plan could either be right on point or be an illusion waiting to blow up in their face. Using the Five S's will ensure you're gaming out your snake draft the right way.
Long-time BaseballHQ.com subscribers know that we preach making good percentage plays that will yield returns in the long run. Well, even a single draft is long in a sense, and by knowing and playing these critical percentages, you are more likely to walk away with a superior roster than by playing hunches and ADPs alone.
Other draft insights
Draft-level data can be used for two other interesting types of insights:
Trend and Break
Often during draft season, we hear touts saying that a player has a lot of "helium" this year (rising draft price) or in some cases a lot of "lead" (falling draft price). Sometimes that is referring to his price this year vs. last year, which daily draft data doesn't help with, but most often that is referring to his current price vs. what it was at some undefined point earlier in the draft season. We can use draft-level data to do much the same, but break it into a few specific metrics for clarity and completeness:
Trend calculates the slope of the player's draft position over time, specifically the % +/- daily movement in draft position. Note that this metric assumes linear movement, which is assuredly not true for all players. But it's useful in picking up even modest trends that might otherwise be tough to spot.
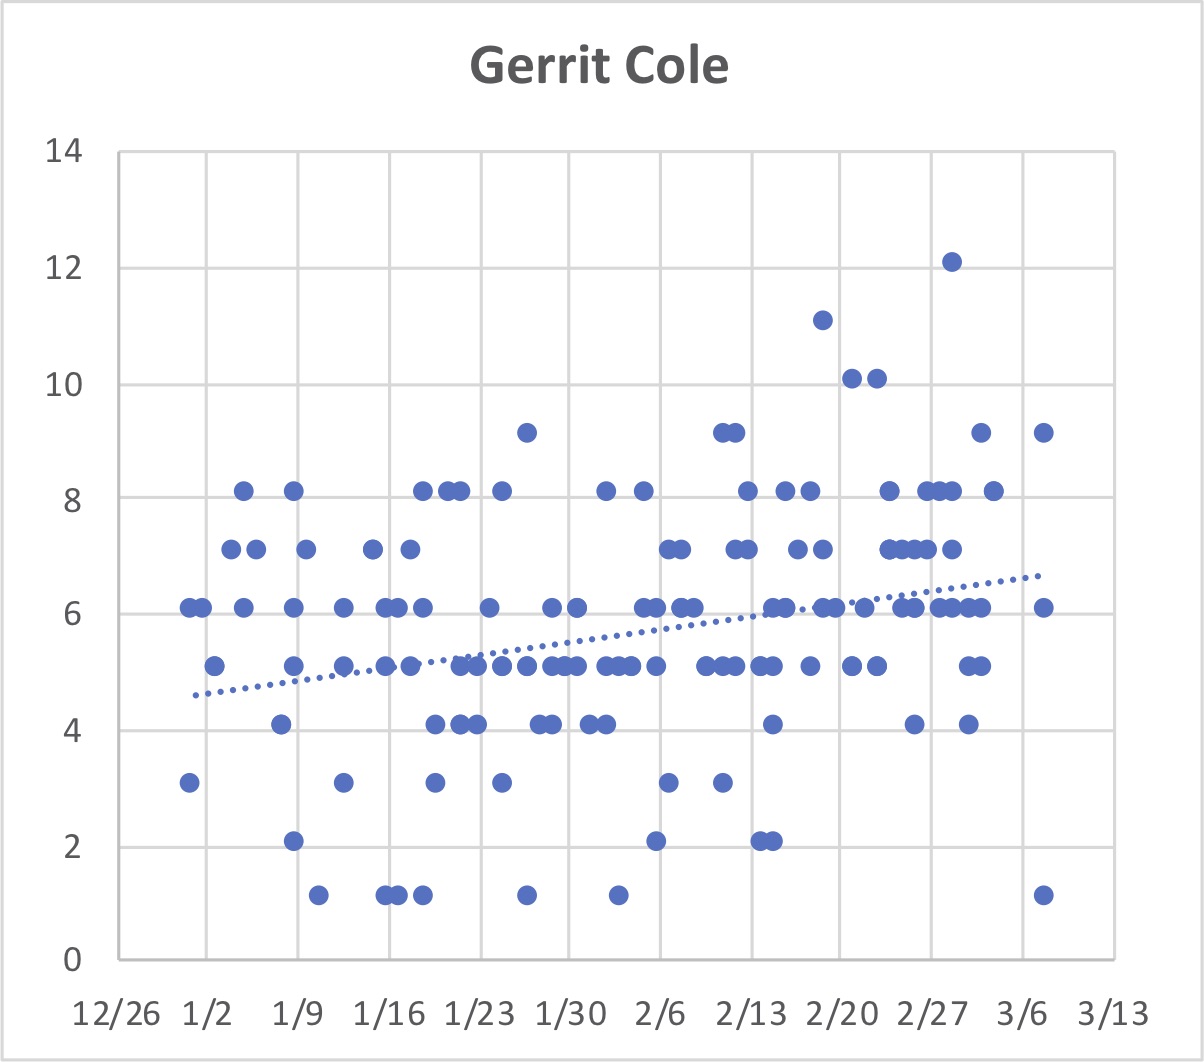
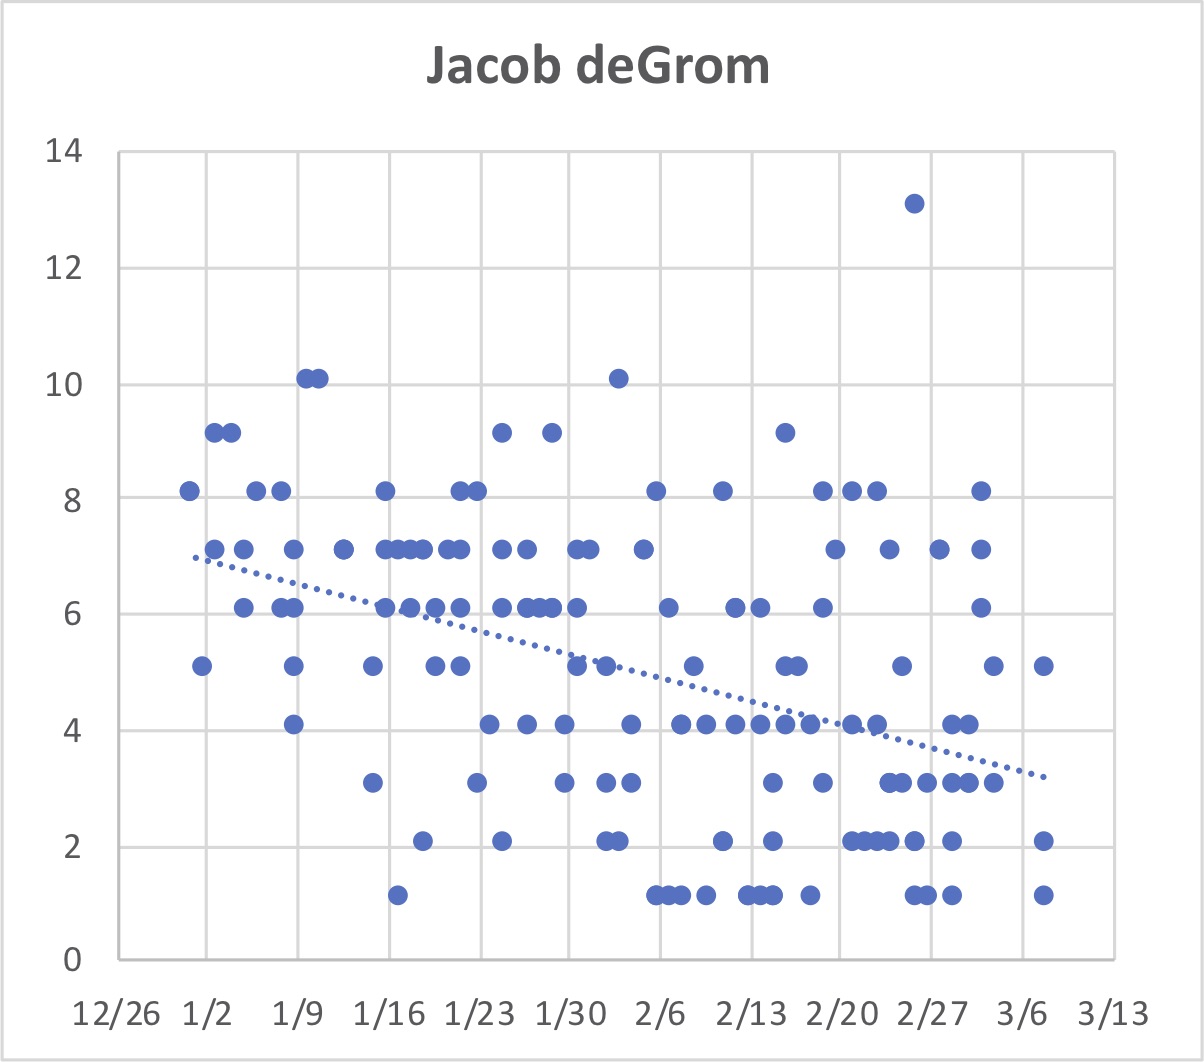
For example, did you know that one of the most distinct trends of this draft season is happening right under our noses in the first 10 picks of the draft? That trend is the rise of Jacob deGrom over Gerrit Cole as the #1 pitcher off the board. DeGrom's DP has been moving steadily earlier by 1.1% per day (which on a basis of 6 is quite subtle) and Cole's has been steadily slipping later by -0.6% per day since January 1st. Take a look:
Other subtle but interesting risers (toward pick #1) include:
- Kirby Yates (0.9% daily)
- José Leclerc (0.5%)
- Brad Hand (0.5%)
- Craig Kimbrel (0.4%)
- Trevor Bauer (0.4%)
- Andrew Vaughn (0.4%)
- Shohei Ohtani (0.3%)
- Eddie Rosario (0.3%)
- Tyler O'Neill (0.3%)
- Will Smith (0.3%)
- Eugenio Suárez (0.3%)
- Adam Wainwright (0.3%)
Other subtle but interesting fallers (toward later in draft) include:
- Ha-Seong Kim (-0.8% daily)
- Dustin May (-0.8%)
- Tony Gonsolin (-0.8%)
- Nolen Arenado (-0.6%)
- Dinelson Lamet (-0.6%)
- Jordan Romano (-0.5%)
- Zach Plesac (-0.5%)
- J.T. Realmuto (-0.5%)
- Dominic Smith (-0.5%)
- Daulton Varsho (-0.4%)
- Garrett Cooper (-0.4%)
- Max Fried (-0.4%)
- Victor Reyes (-0.4%)
- Rowdy Tellez (-0.4%)
- Wilmer Flores (-0.4%)
- Mookie Betts (-0.4%)
Break calculates each player's ADP for the latest 2 weeks minus his ADP for the prior 2 weeks. This metric reads like a list of recent headlines — a who's who and what's what of draft season news. Unlike Trend, we present Break as an absolute number, not as a percentage relative to ADP. This helps surface the most significant changes in the market up and down the draft board.
Players with high positive/negative Break are generally those for whom something good/bad has happened that fantasy managers should know about. High positive Break players are often those who signed with a new team, won a job, or performed well in Spring Training. High negative Break players are often those who got traded to a worse team context, lost a job, or got injured.
Combination probabilities
Perhaps the most unique and useful benefit of using draft-level data is being able to estimate the % likelihood of getting any one of a set of target players at a certain draft position. Some fun examples of what we can now do and how the math behind it works:
• Let's say you're in 9th position and are tempted by José Ramírez over Trevor Bauer, but you still want an ace. What are the chances that at least one ace makes it back to you at 2.7 (22nd overall)? Using ADP, the best you can do is think "I'll take José Ramírez and hope one of Darvish, Giolito, Buehler, or Nola falls to me in Round 2." With draft-level data, we can now calculate the likelihood of one of them falling. To do this, we take the product of the likelihood of each of them NOT falling, and subtract it from 1 to arrive at the chance of one of them falling. In this example, there's an 89% chance Darvish won't make it back, a 91% chance Giolito won't, a 64% chance Buehler won't, and a 57% chance Nola won't. So, the chances of one of them making it back are 1 - 89%*91%*64%*57% = 71%. Any one of them on their own doesn't seem likely to make it back, but one of the group? I'll take José Ramírez plus those odds.
• Sadly, probabilities are still no guarantee, so you can't always assume your bets will pay off. In my aforementioned TGFBI draft, I got a little cute in Rd11 by taking Dylan Carlson as my 3rd OF instead of the 2nd baseman I felt I needed to round out my roster. But I calculated that one of my 2B targets would make it back around to me, and Carlson himself only had a 14% chance of being there at 11.7 in the first place, so he felt like a steal (see those 5 S's above). Specifically, I was interested in one of Nick Solak, Ian Happ, or Nick Madrigal. The odds of each player making it back to me in Round 12 were Solak 27%, Happ 24%, and Madrigal 61%, and as a backup I thought Sean Murphy at 30% was attractive at 12.9 as well. Combined, the probability of at least one of them making it back was 1 - 73%*76%*39%*70% = 85%. It wasn't enough. All four of them went in the next 8 picks. But the odds were in my favor!
Breaking free from ADP
We already know what you're thinking: "I can't go into my next draft without these insights!" We agree with you — it would be criminal fantasy baseball negligence to do so. However, this research is hot off the press and did we mention it's kind of a pain to pull this daily data, transform it, load it, and re-run everything based on the latest days' drafts?
Feel free to leave specific questions or comments below, on specific draft situations, combo probabilities or whatever else comes to mind. In case you missed it up top, here's the link again to download this summary spreadsheet through 3/14 containing all of the metrics described above for the Top 600 players. We hope to find a way to update and distribute this as draft season rolls on.
More From R&A Studies

Outmaneuver your competitors by replacing watered-down ADP with detailed draft-level analytics for 12-team and 15-team mixed leagues.
Mar 17 2025 8:10am
Mar 17 2025 8:10am

Outmaneuver your competitors by replacing watered-down ADP with detailed draft-level analytics for 12-team and 15-team mixed leagues
Mar 22 2024 12:55pm
Mar 22 2024 12:55pm

Updating xSB in light of recent MLB rule changes.
Feb 9 2024 3:02am
Feb 9 2024 3:02am

The pitching landscape has shifted yet again, and our Pure Quality Start metric undergoes a minor shift to level-set the results.
Dec 20 2023 10:10am
Dec 20 2023 10:10am

2023 draft-level analytics from dozens of individual NFBC drafts to complete your last-mile preparation
Mar 26 2023 1:00pm
Mar 26 2023 1:00pm
